Conversion Rates: How They’re Measured & How You Should Be Thinking Of Them
As you are aware, conversion rates are frequently used as a KPI to evaluate the effectiveness of e-commerce sites. Naturally, all site owners and administrators are interested in benchmarks and how their conversion rates stack up. It's more crucial than ever to assess and improve your marketing success indicators as marketers prepare for 2022.
We have gathered various free industry resources that concentrate on retail e-commerce conversion in this post. Towards the end of the essay, we also include an analysis of lead generation conversion rates by industry sector on landing pages. As new conversion data were released in 2022, we updated this compilation.
How are e-commerce conversion rates actually measured?
The denominator must be considered for benchmarking conversion. Do you divide total sales by total sessions or by the total number of unique visitors?
The popular standard reference, Google Analytics, divides sales transactions by visits. According to Google, the e-commerce conversion rate is:
“The proportion representing the ratio of transactions to sessions. For instance, an Ecommerce Conversion Rate of 10% would describe a ratio of one transaction for every ten sessions”.
Before we discuss the statistics, there are a few limitations to benchmarking conversion rates:
We believe it’s critical to communicate to marketing managers the need to segment conversion by distinct visitor kinds when benchmarking conversion rates, which goes beyond headline conversion rates.
Regional retail conversion rates
Developing country-specific KPIs for subsets of your consumer base might be especially helpful if your marketing plan uses geo-targeting. The important thing is that these statistics inform your goals rather than defining them.
The Kibo e-commerce Quarterly is an excellent resource for large e-commerce firms, providing often updated benchmarks on conversion in the US, GB, and EMEA, separated by devices and media.
The most recent statistics from Kibo are from Q2 2021. Average add-to-basket rates are also included in the complete report.
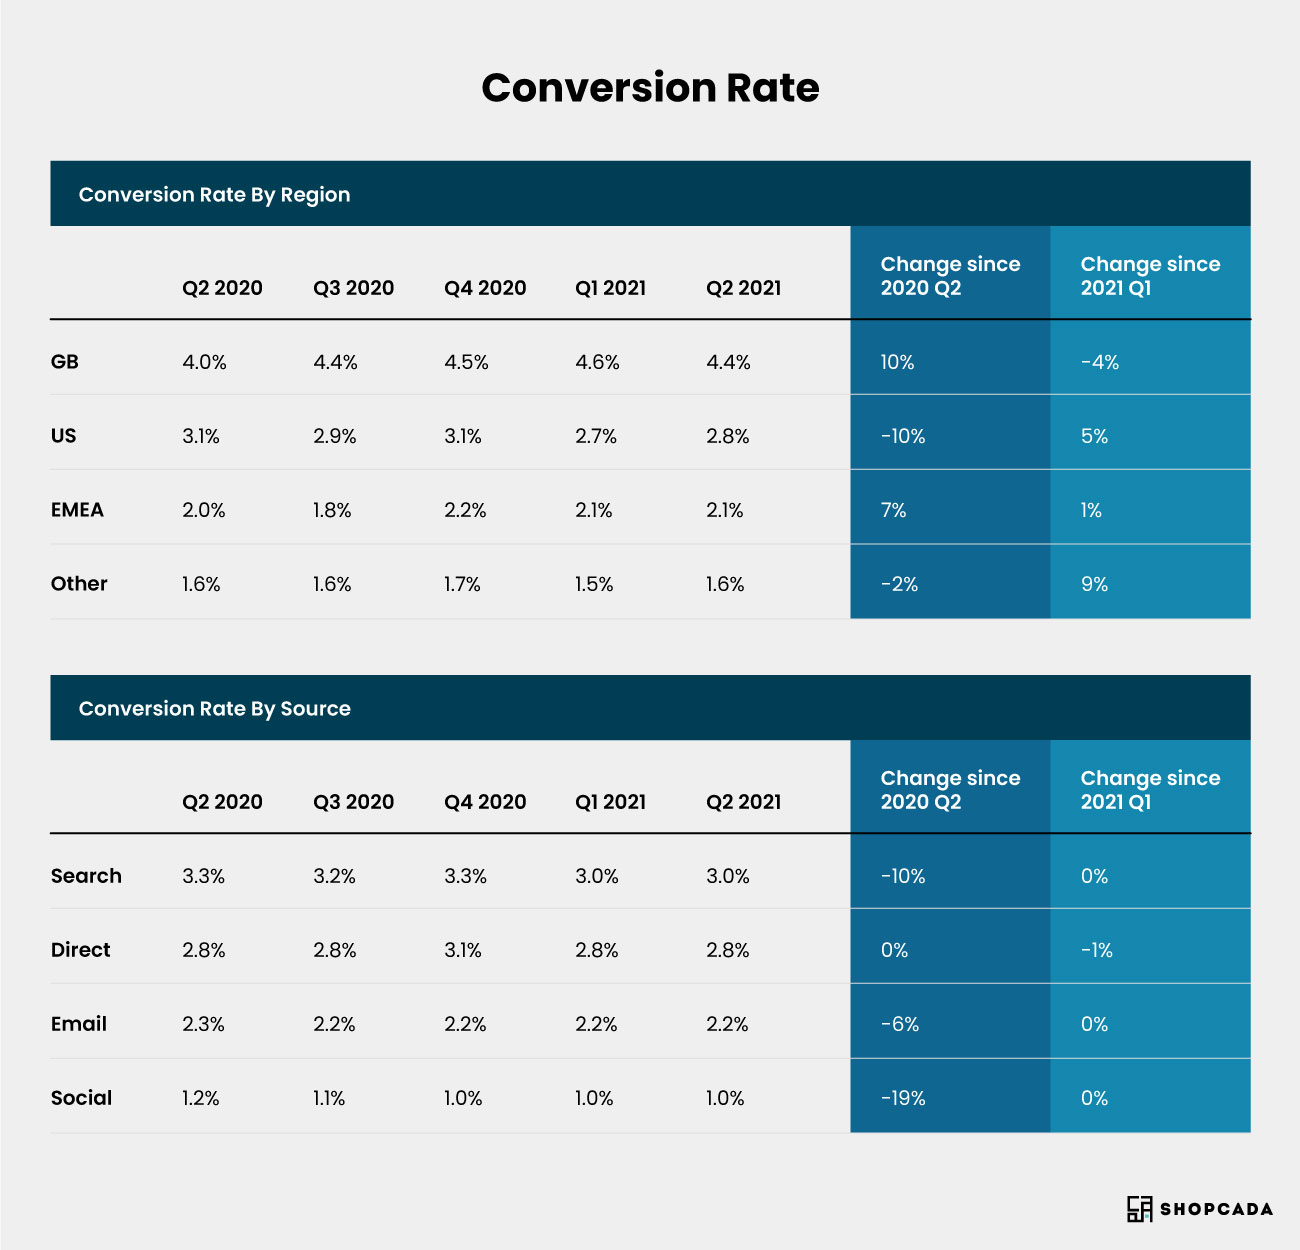
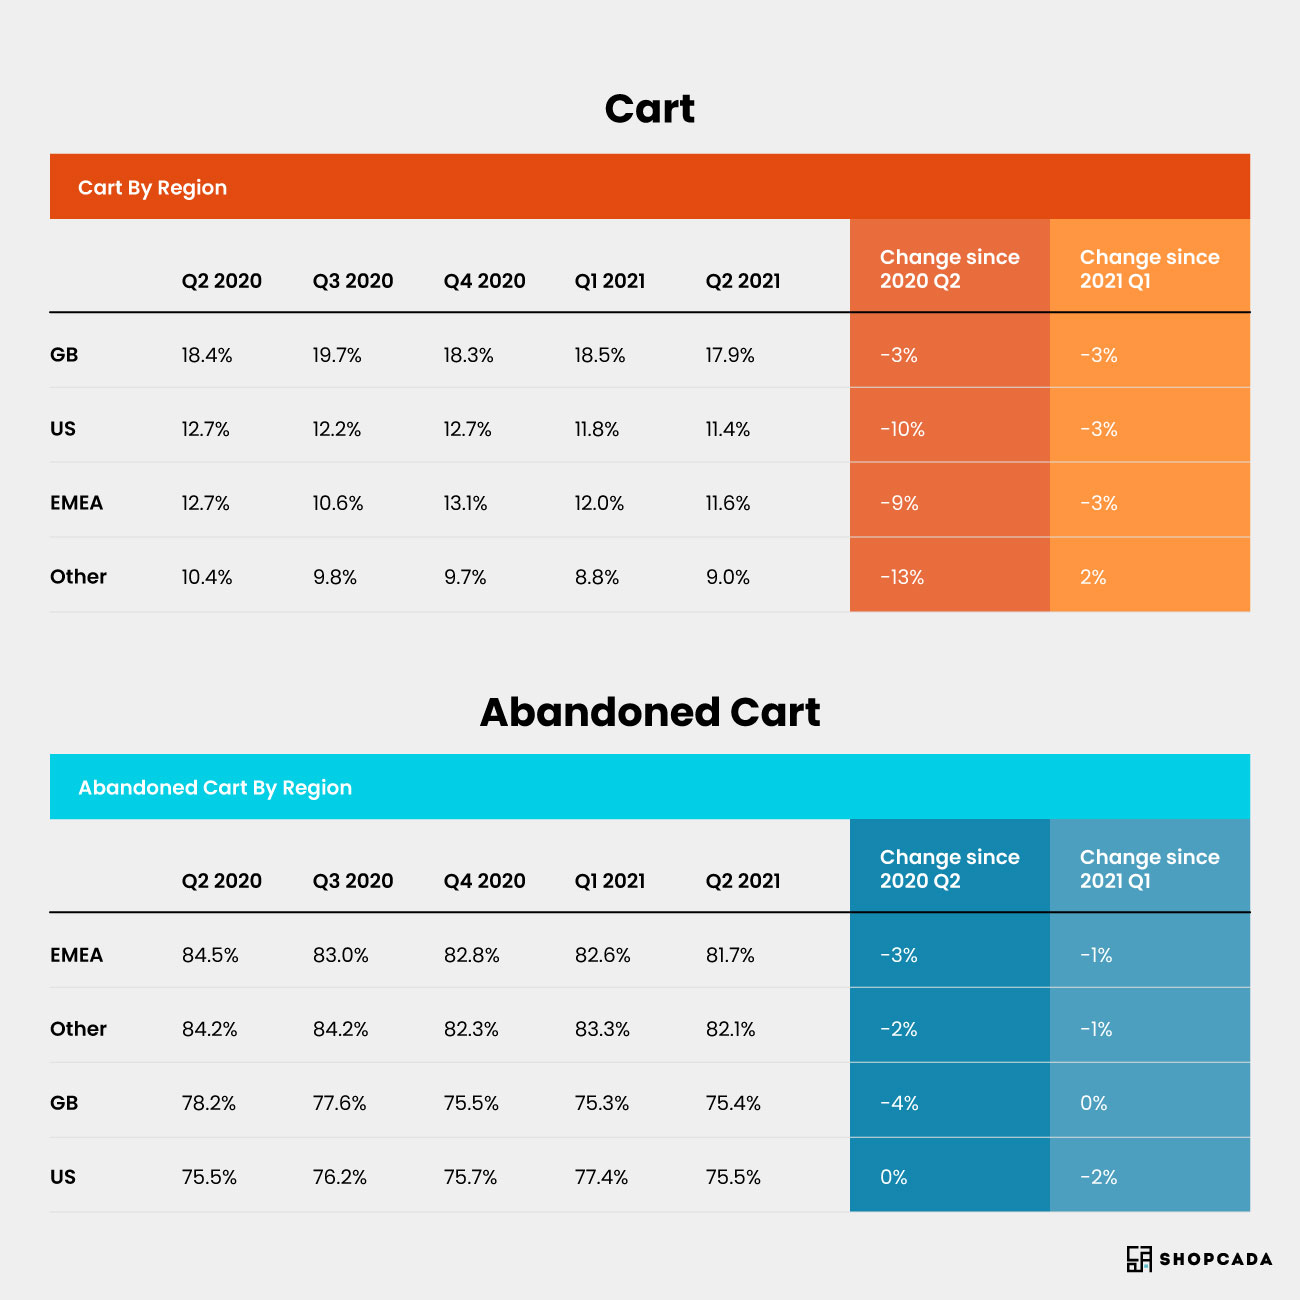
To get a complete picture of the funnel, it's also helpful to include the cart and abandoned cart rates here.
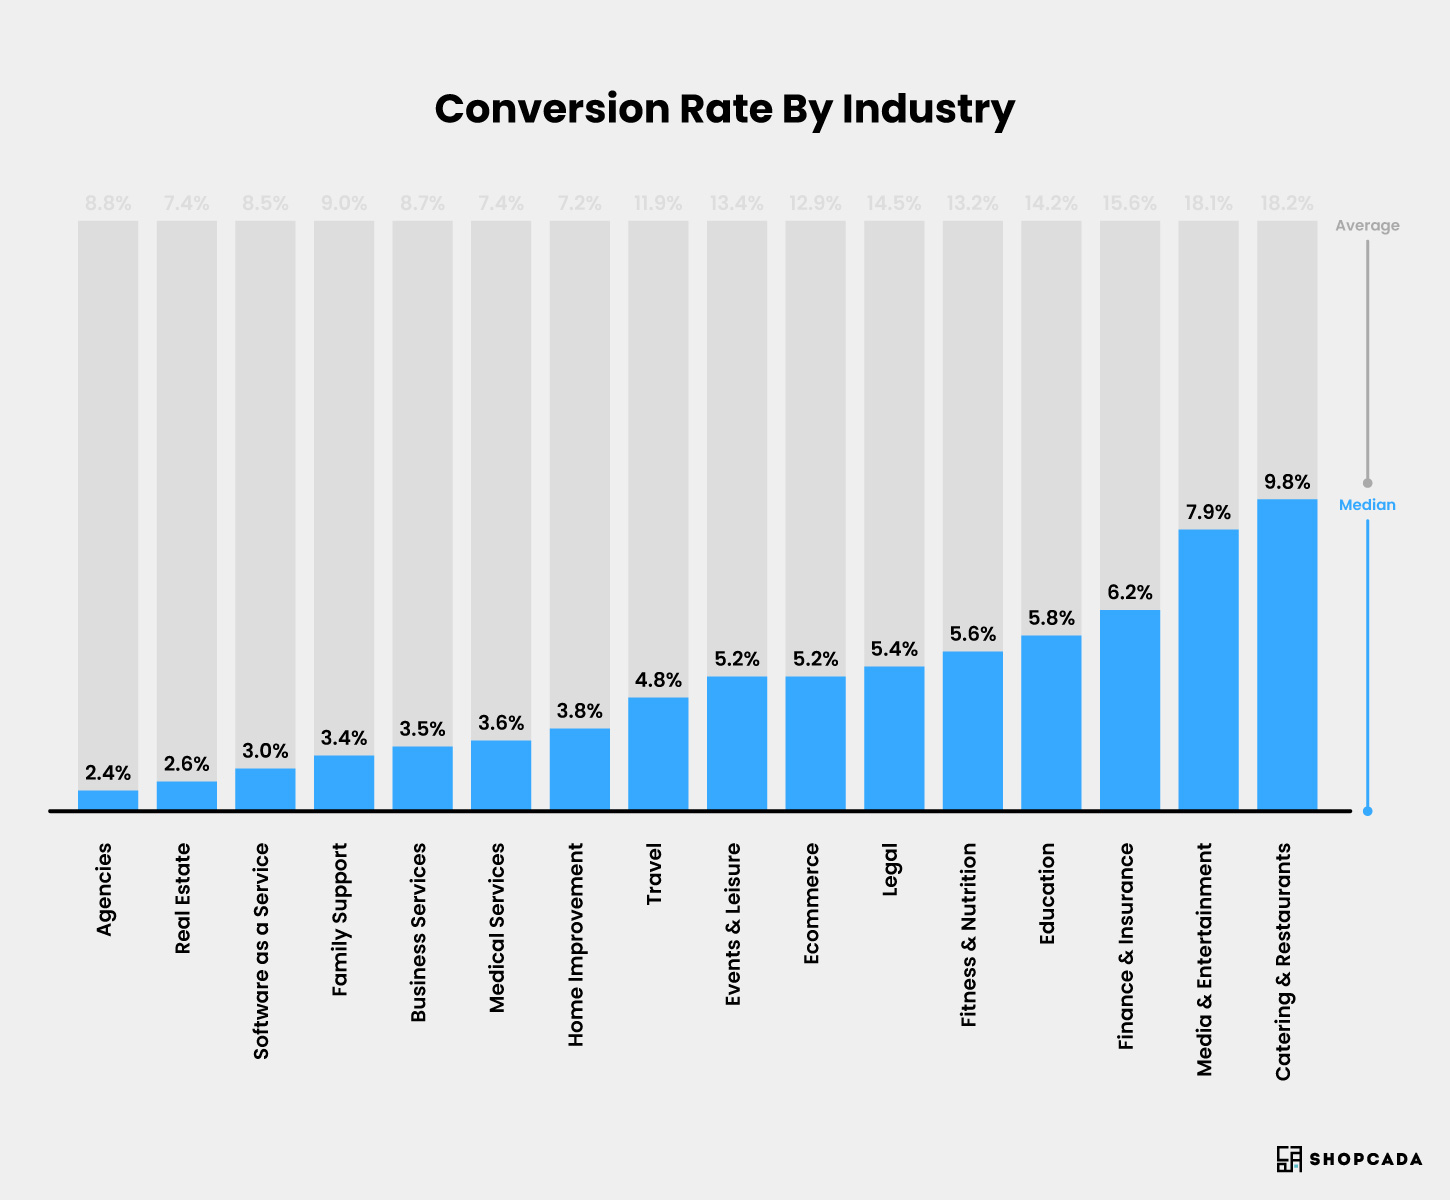
Benchmarks for e-commerce conversion by sector
A lot of marketers base their KPIs on industry averages. A decent conversion rate could nonetheless be lower than the industry average, for instance, if you're targeting a market with a lower overall conversion rate.
With an average conversion rate of 9.8%, catering & restaurants came out on top in Unbounce's 2021 Conversion Benchmark Report's comparison of landing page conversion rates across 16 industries. The other end of the spectrum is represented by agencies and real estate, which only convert 2.4% and 2.6%, respectively.
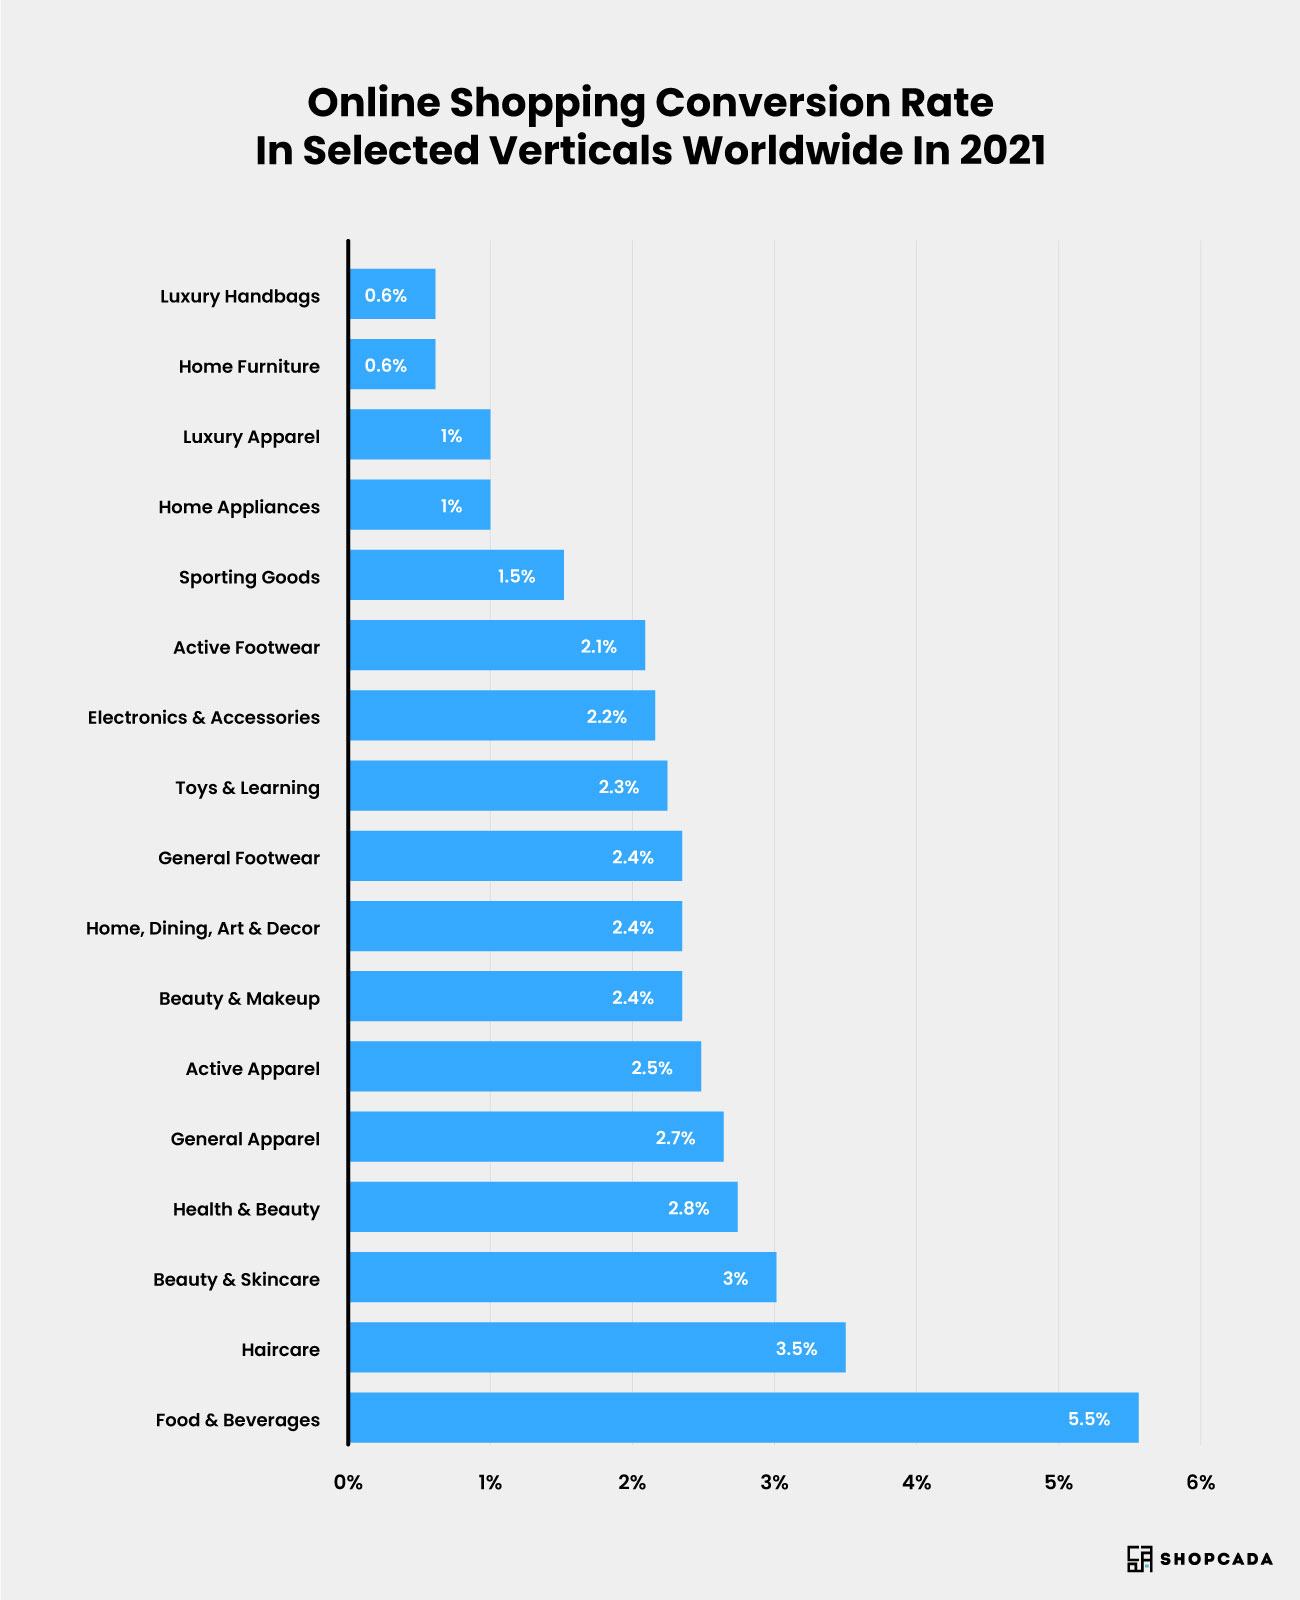
Food & beverage is the top online shopping category for conversion rate in the first quarter of 2021, according to statistics from online purchases made in April 2021. In 2021, hair care, skin care, and health and beauty had the next-highest conversion rates. Luxury goods, home furnishings, and appliances appeared to convert significantly lower in 2021.
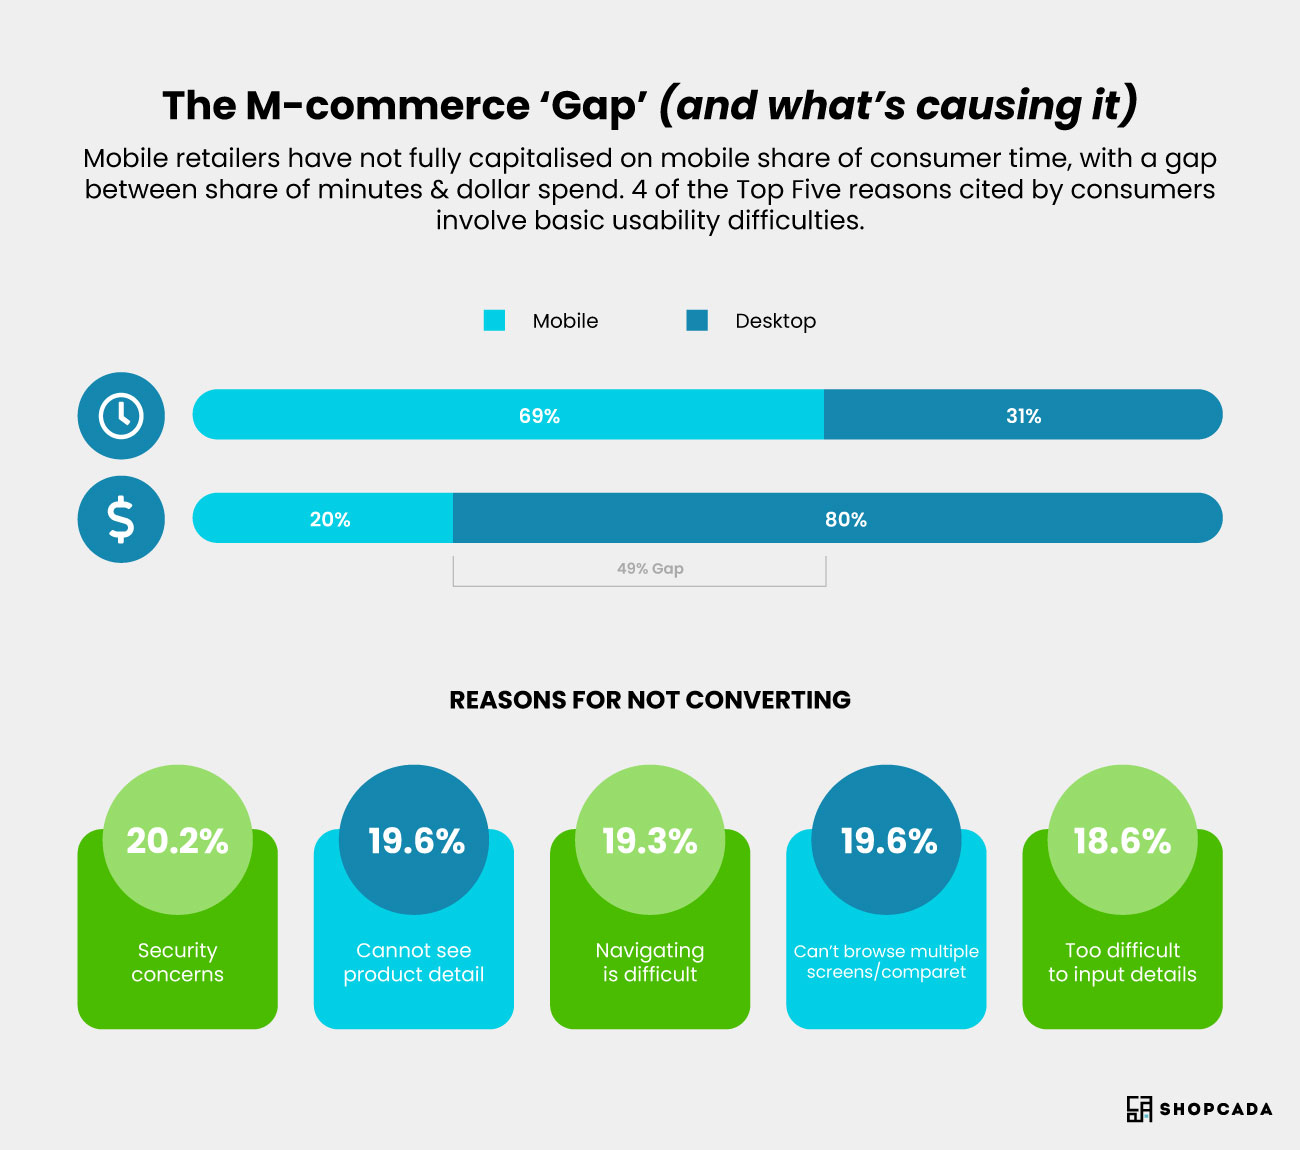
Rates of mobile e-commerce conversion
Online retailers must understand which conversion benchmarks they should be hitting on a smartphone device because more and more consumers are making purchases using their smartphones and tablets. In Q3 2020, the average order value globally was 42% greater on a desktop than on a mobile device.
For marketers wishing to enhance their clients' multichannel digital shopping experiences, we advise them to check out our advanced module for mobile and multiscreen usability.
Information on conversion rates by operating system is also available:
This demonstrates that conversions for iOS are marginally higher than for Android, and modifications for Windows are noticeably more significant than Mac. How much of this is based on usability compared to other demographics is still being determined.
Rates of omnichannel conversion
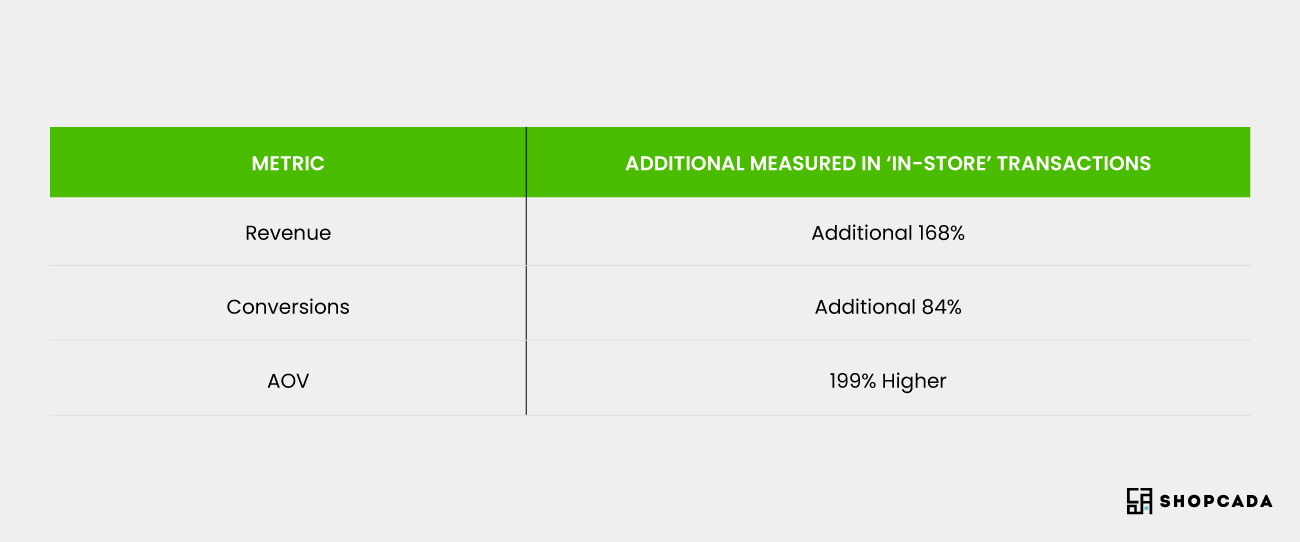
Many published conversion rate compilations simply take into account online conversion to sale. Google and Wolfgang Digital's research highlight the "research-online-purchase-in-store" model.
Retailers may now link in-store buyers with online ad clickers by uploading Point of Sale information to Google, giving them more insight into the effectiveness of their campaigns.
The numbers speak for themselves: In addition to their online sales, digital marketers saw an additional 168% revenue from their in-store sales.
Why are people less likely to make purchases on smartphones?
Retailers can use the comScore Mobile Hierarchy report's information to improve their customer service or to send messages to reassure customers.
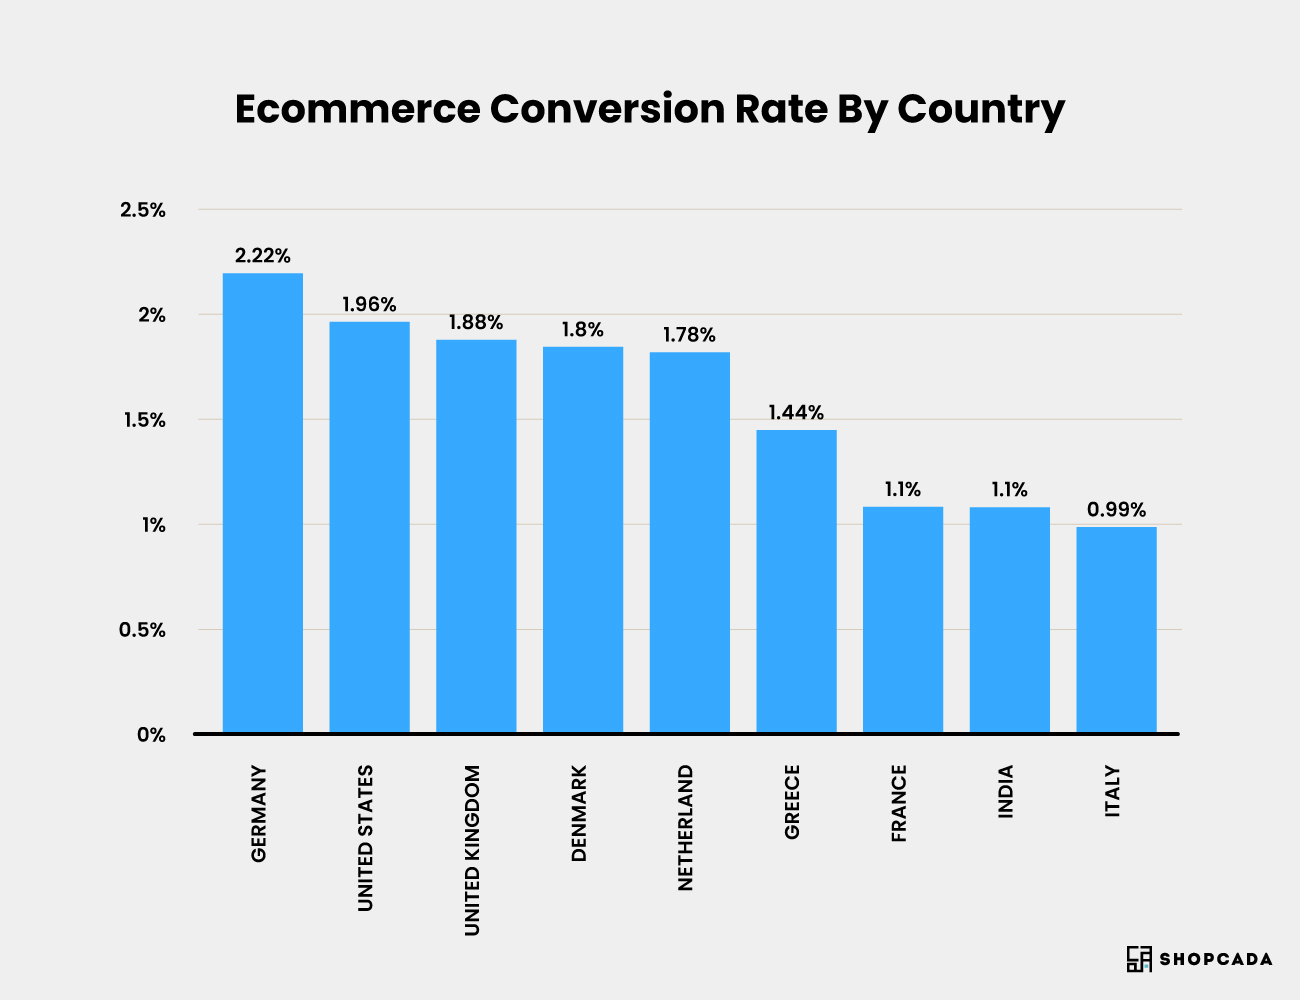
Conversion rates for e-commerce by nation
Developing country-specific KPIs for different consumer base groups can be pretty helpful. If you're serving a market with a lower overall conversion rate, it can also be required to modify KPIs based on industry benchmarks. As always, the idea is to use these statistics to inform rather than define your goals.
Italy is behind Germany in the table below, with a conversion rate of 0.99%, while Germany leads with an average of 2.22%.
Conversion rates for mobile Google Ads across several business sectors
The criteria for clickthrough and conversion rates across industries for Google Ads in 2021 demonstrate that:
Google Ads on mobile have an industry-average conversion rate of 3.48% on the search network and 0.72% on the display network.
Since searchers use the search network to enter product and brand names with a specific intent, it is not surprising that the conversion rate in the search network is significantly greater than in the display network. In contrast, they react to banner and text advertisements on publisher sites in the display network.
If you are a startup modelling conversion rates as part of a business plan or want a high-level comparison of your actions with others in your industry, the results from 18 sectors may be helpful.
The result assessed as the conversion rate will vary based on the industry and the kind of term. For instance, brand searches always have higher clickthrough and conversion rates compared to generic searches. In the retail industry, the conversion will result in a sale, but in many other sectors, it will result in a lead.
Online store conversion funnel
This funnel-based view of the conversion process is helpful since it displays not only the typical basket and sales conversion rates but also the less frequently reported conversion rates to product page views:
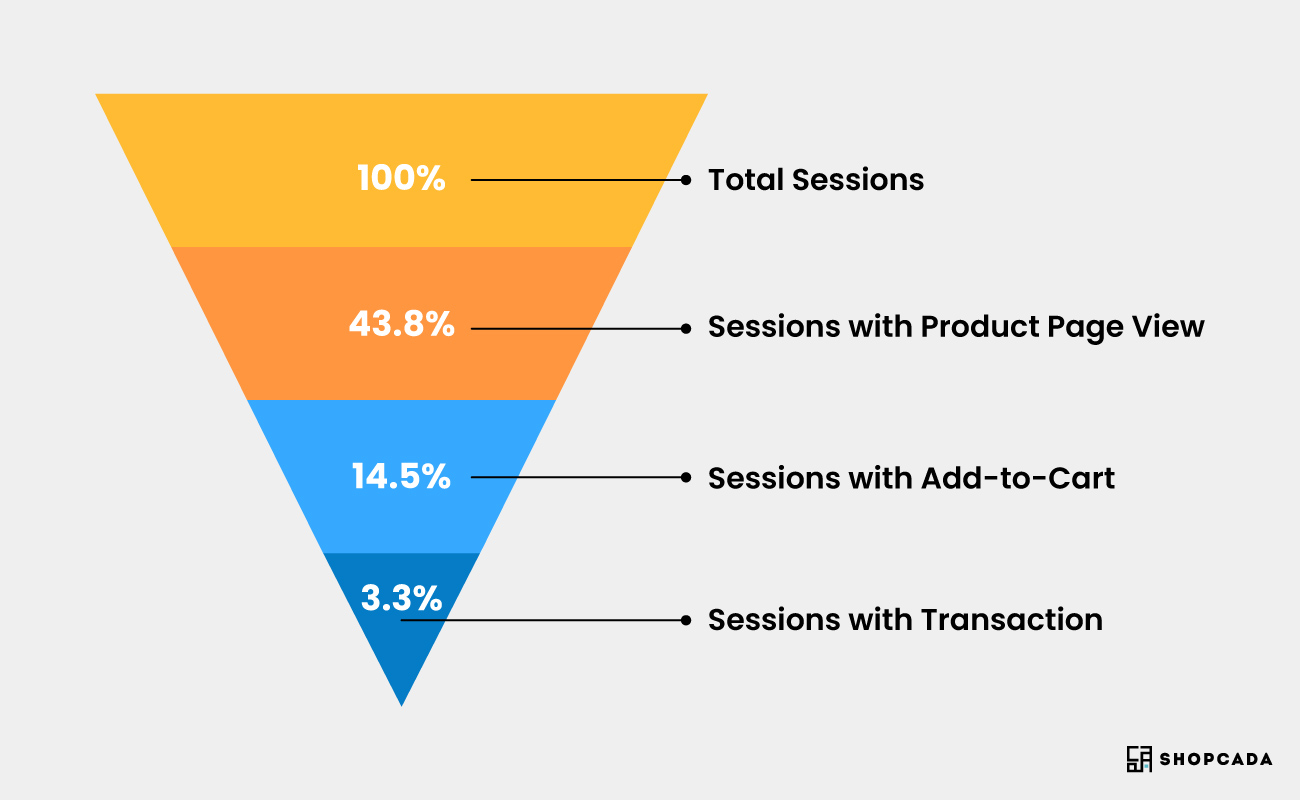
The number of sessions with product page views is significantly greater than the other micro-conversions and is almost 50% higher than would be predicted. This serves as a helpful benchmark and reminds businesses that while implementing site design enhancements, it's essential to consider conversion to product page views.
It also serves as a reminder of the importance of sending targeted automated browse-abandon emails to follow up on interest in particular products and categories.
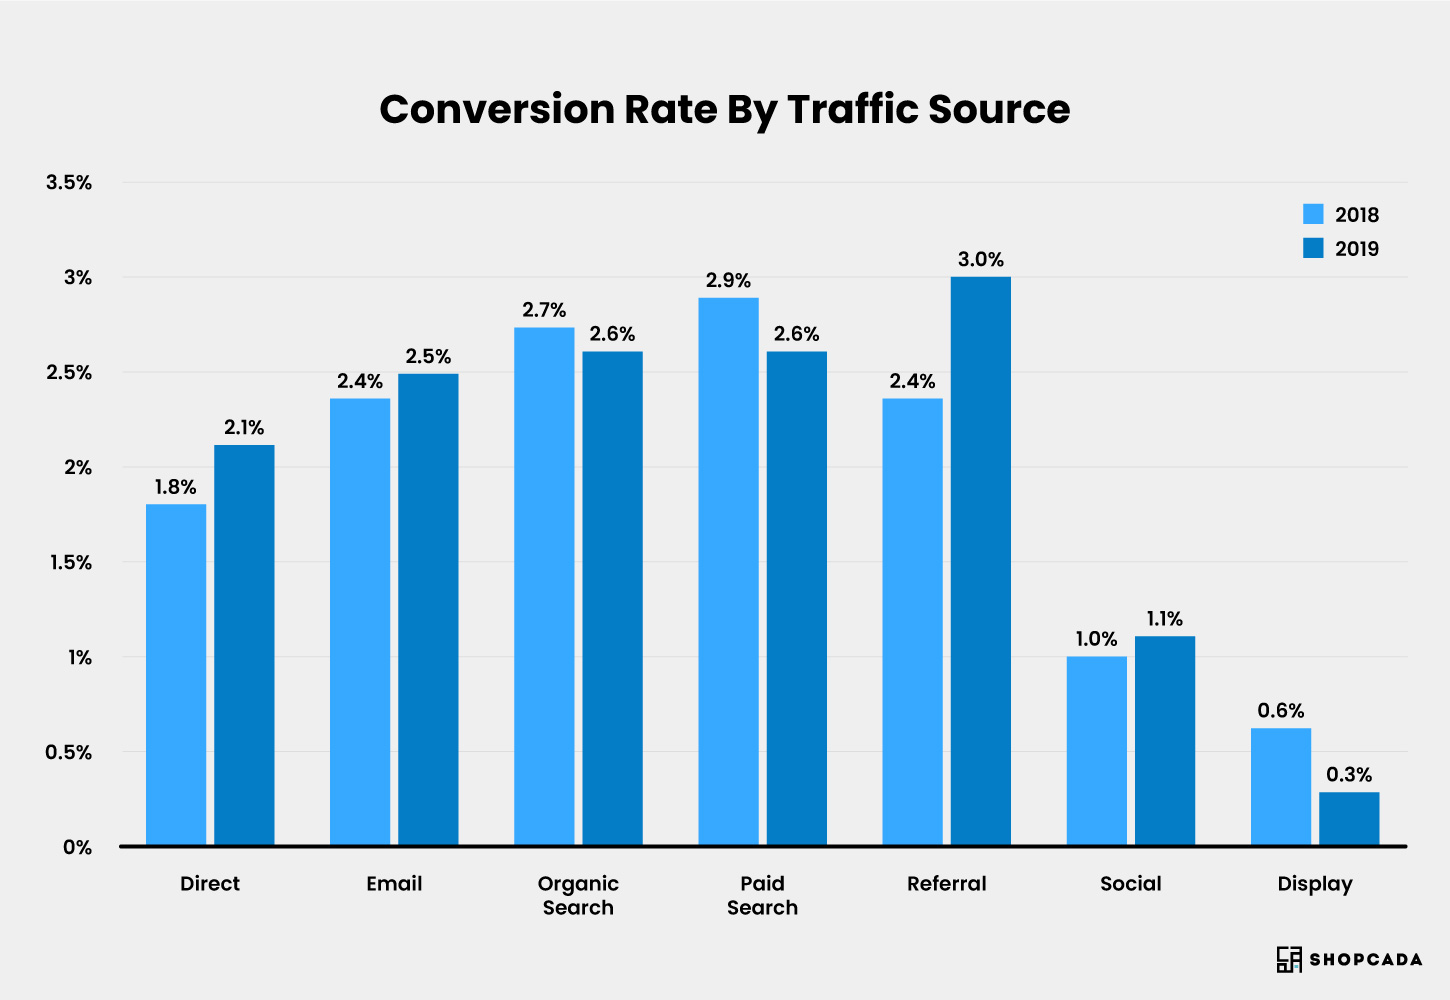
Conversion by channel
Based on 1.3 billion shopping sessions across 159 distinct retail and consumer brand websites, this analysis from Optimizely Episerver retail clients Q1 2020 illustrates a familiar pattern. Where consumers have greater intent, i.e., are actively shopping for products, conversion rates are much higher. In contrast, conversion rates for visits from social and display referrals are much lower.
Options for dividing e-commerce conversion rates into categories
Dan Barker advises in his tip, which we stated at the beginning of this post, that the conversion rate becomes more valuable as you split it down by various visitor kinds, each with a unique goal and relationship to the merchant.
To understand and strive to enhance the quality of traffic or the strength of offers, different conversion rates and average order values can therefore be segmented for different audiences, for instance:
-
Conversion of new, returning, or enrolled customers
-
Conversion of referral channels, such as paid or organic search, social media, affiliates, and display advertising
-
Type of search, such as paid or organic, name-brand, generic, or long-tail
-
Compared to a more expensive product frequently purchased in-store, simple commodity products, like flowers, have substantially greater conversion rates (double-digit percentages) (for example, beds or furniture, which will often be less than one per cent).
-
The IMRG statistics and Coremetrics data below demonstrate that conversion rates can significantly rise during these times, regardless of the type of promotion or seasonal sale.
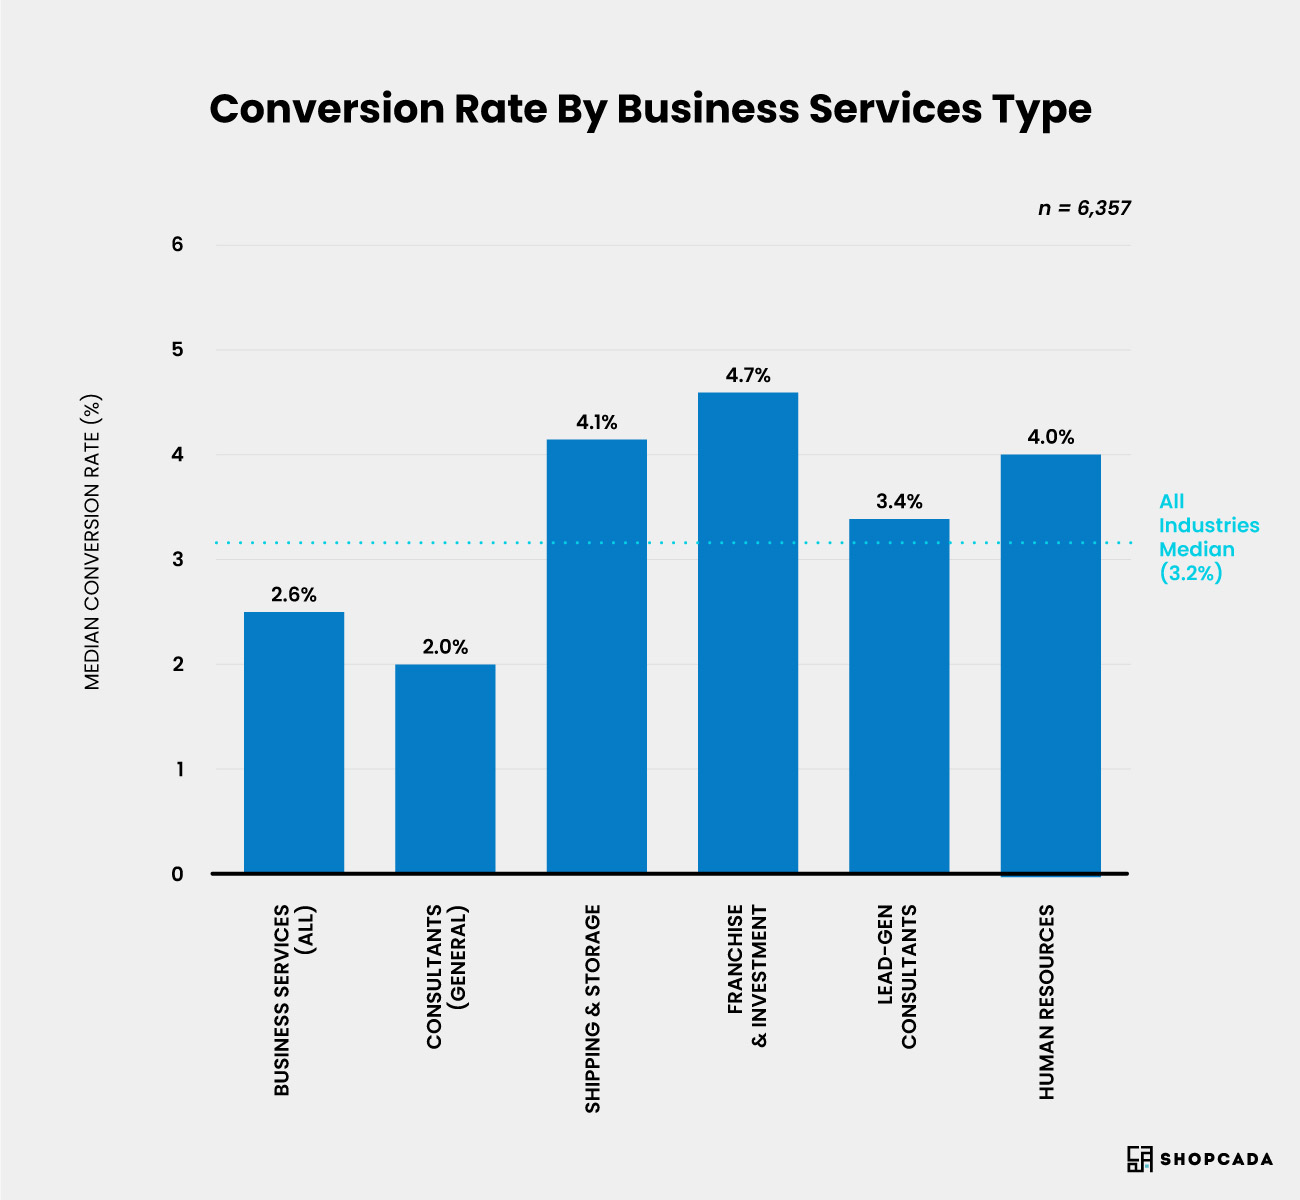
Sector-specific lead generation & landing page conversion rates
According to Unbounce's 2017 landing page lead generation conversion rate research, lead conversion rates vary by industry. The business-to-business, travel, healthcare, legal, and educational sectors are among the industries served.
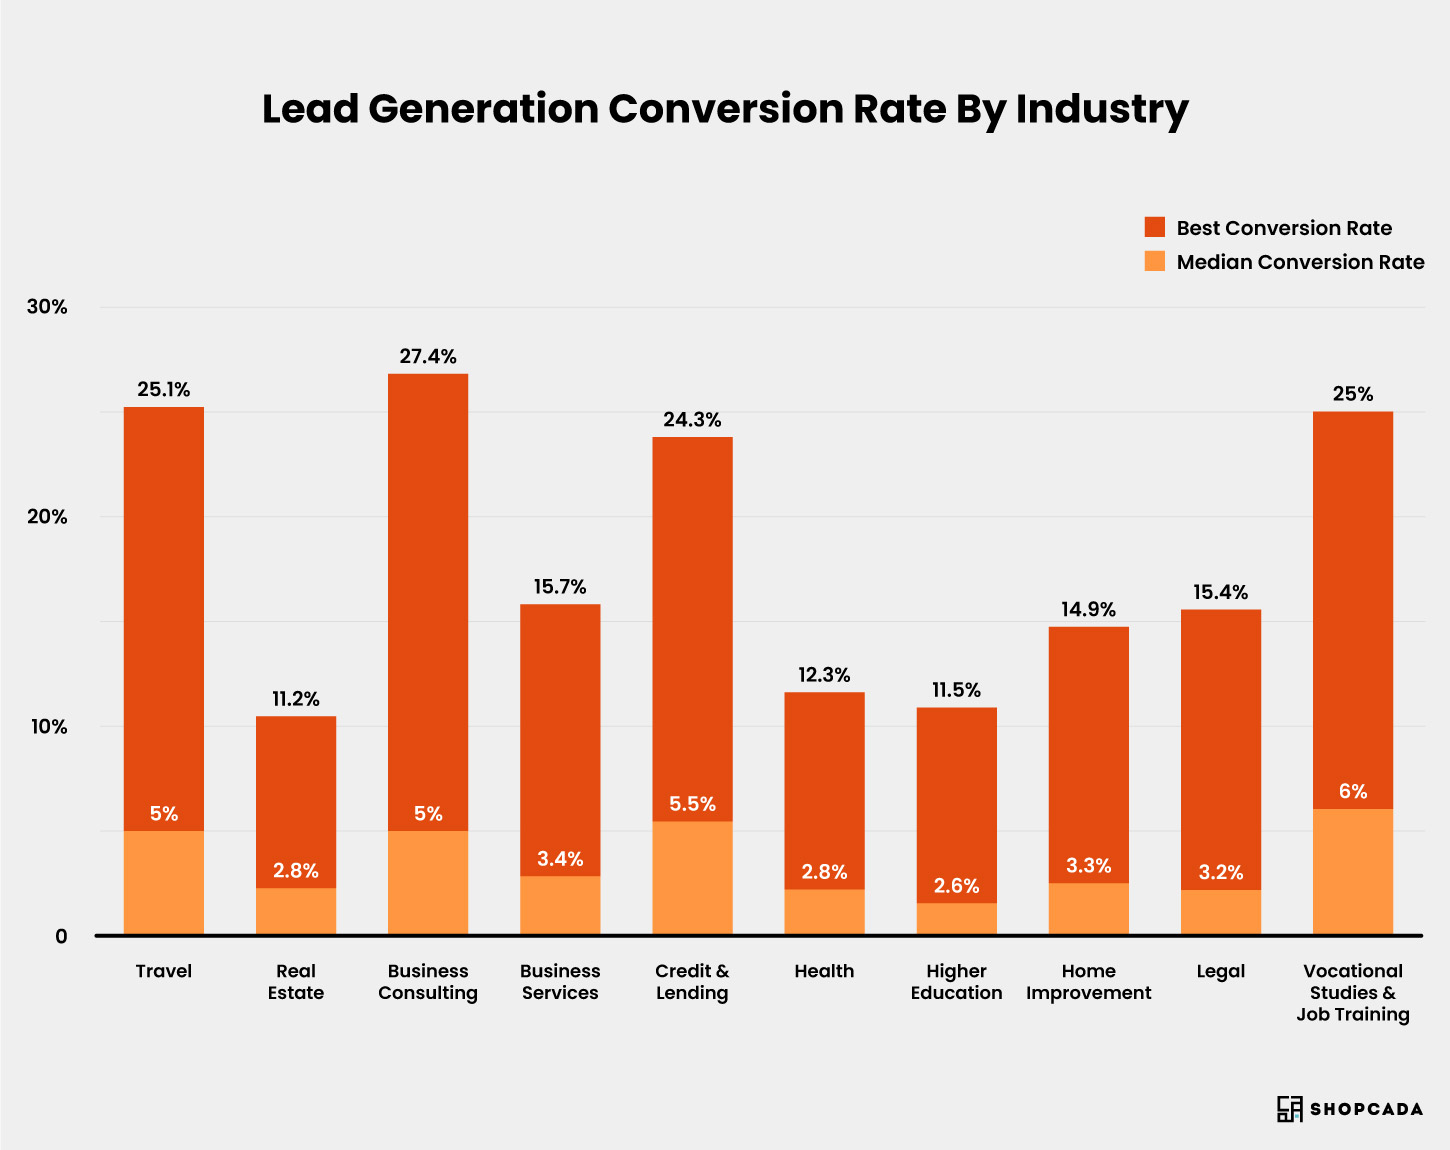
The graphic demonstrates the vast range of performance across industries and within sectors, with some companies outperforming the media regarding lead-generating conversion rates. Therefore, comparing the media rates, ranging from 2.8% to 6%, is better.
This older version was kept because it displays the range of conversion rates. Unbounce published a fresh roundup of landing page conversion rates in 2020.
Comparison of conversion rates for completed forms
The Zuko form performance standards, released in October 2021, are a further resource for comparing lead generation effectiveness because they offer unique insight into how the process is broken down by industry.
Purchase, enquiry, and registration data are among the form types. The majority of forms that were tracked were transactional. However, the whole breakdown is shown here.
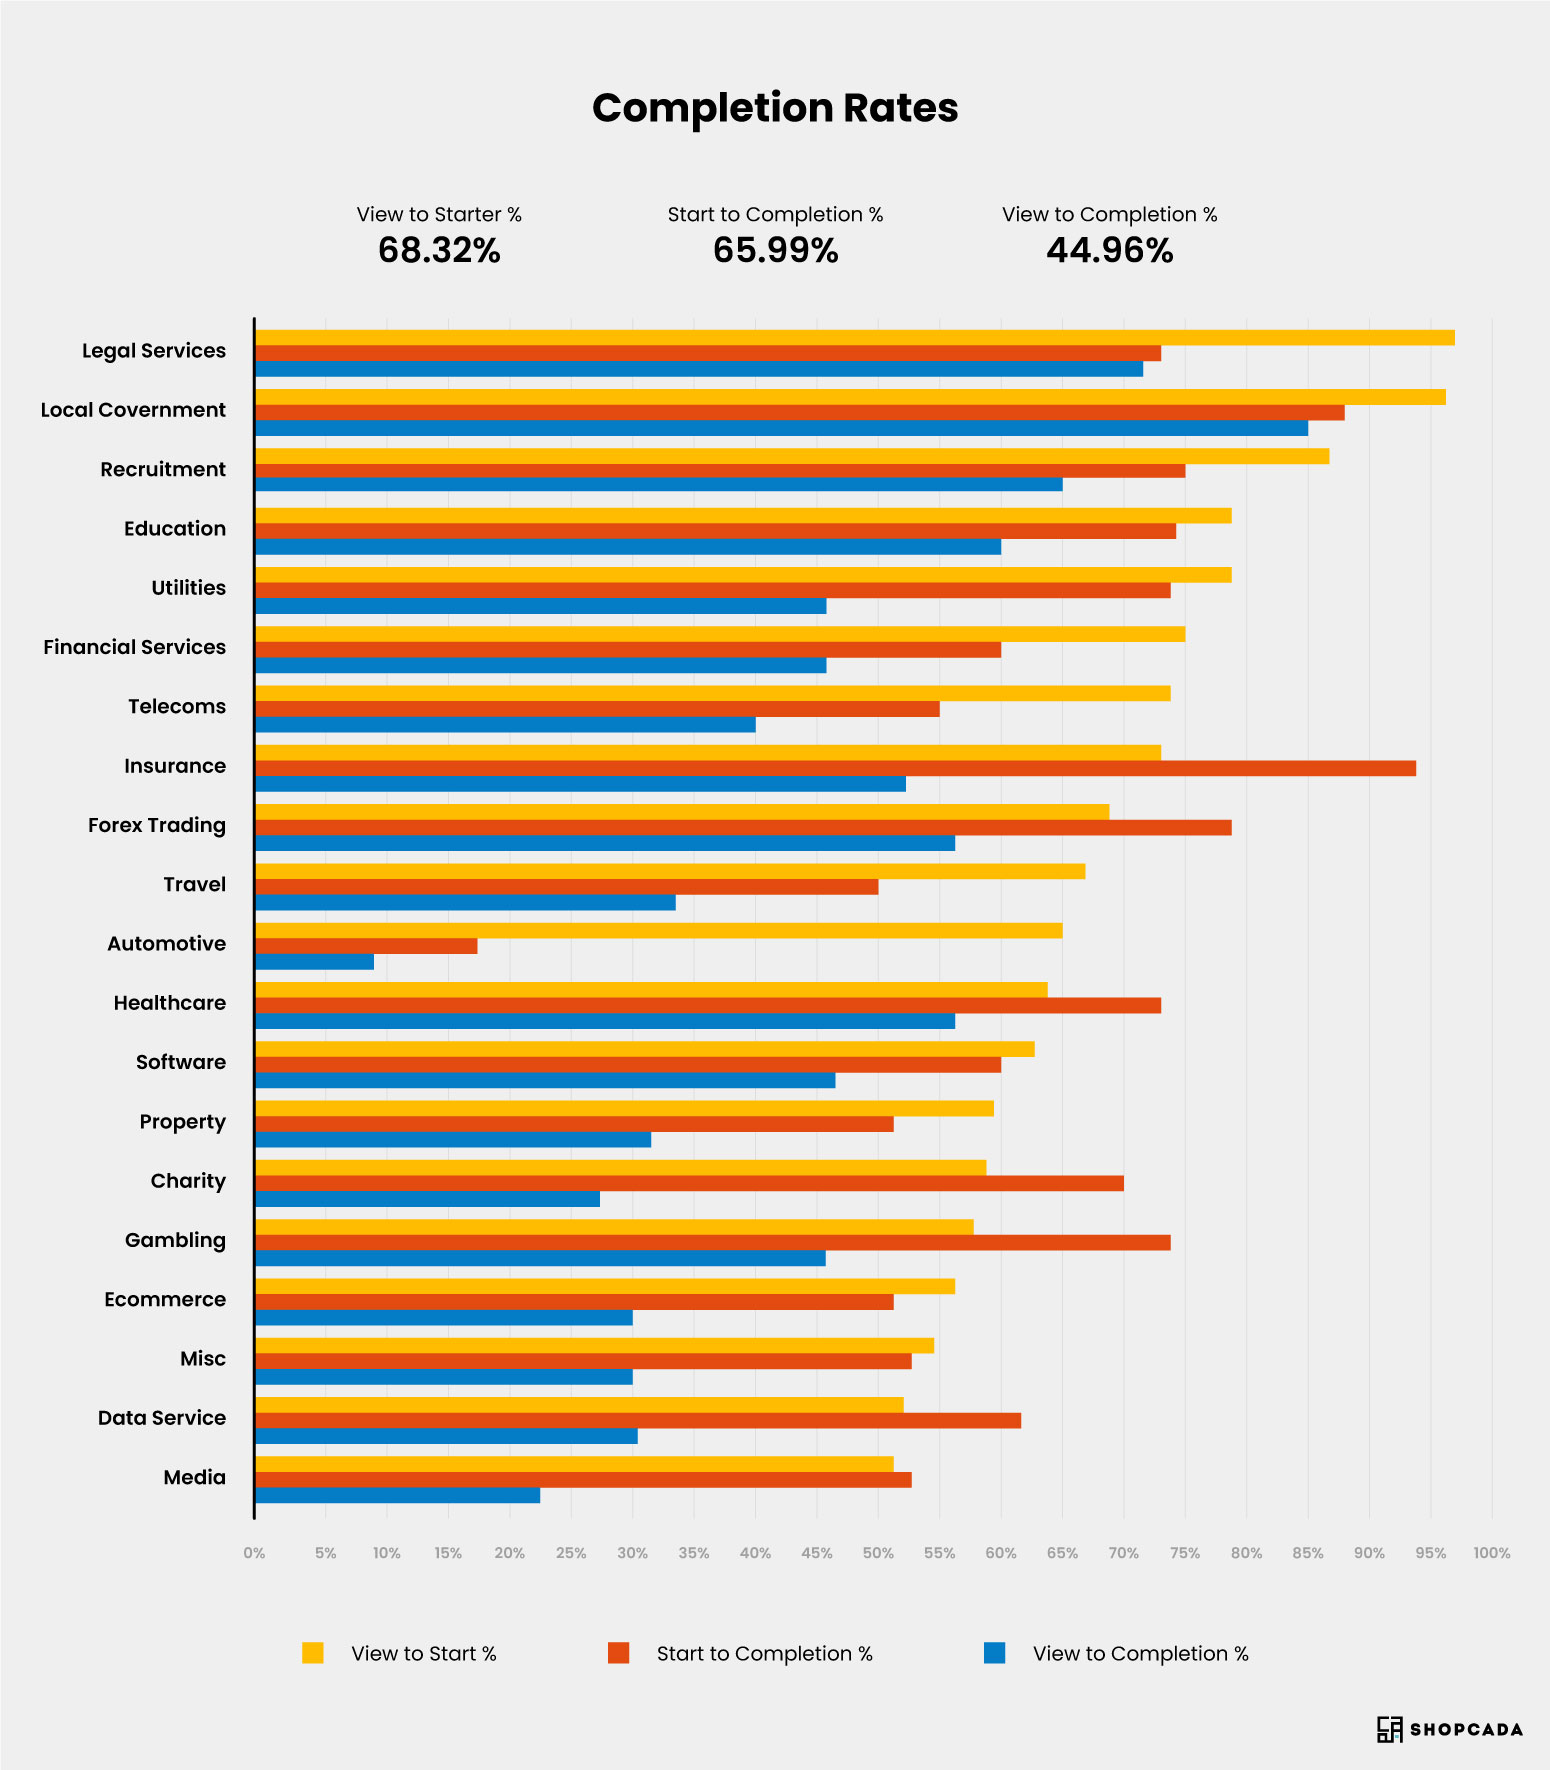
This demonstrates the need for AB testing to ensure you communicate the value of completing the form through the title, copy, images, and follow-up. Typically, just one-third of users begin entering data into the form. Generally, just about half of each form is filled out.
Closing Words
A well-designed website is essential for immediate and long-term success as online shopping becomes increasingly important in retail and e-commerce enterprises.
Businesses should place the highest importance on increasing ecommerce conversion rates because they motivate consumers to do what is most crucial — purchase your goods.