The Most Important Social Media Metrics For Your Campaigns
Any social media plan that is worth its salt must be adequately measured. However, you might be astonished at how many marketers fail to consider looking beyond the information on the "Overview" page.
Everyone agrees that keeping track of those statistics is important, which is why they are right up front, but digging deeper can yield more insightful information.
In order to increase brand exposure and raise social media ROI, let's take a look at the top platforms and determine the best social media metrics you should monitor for each one.
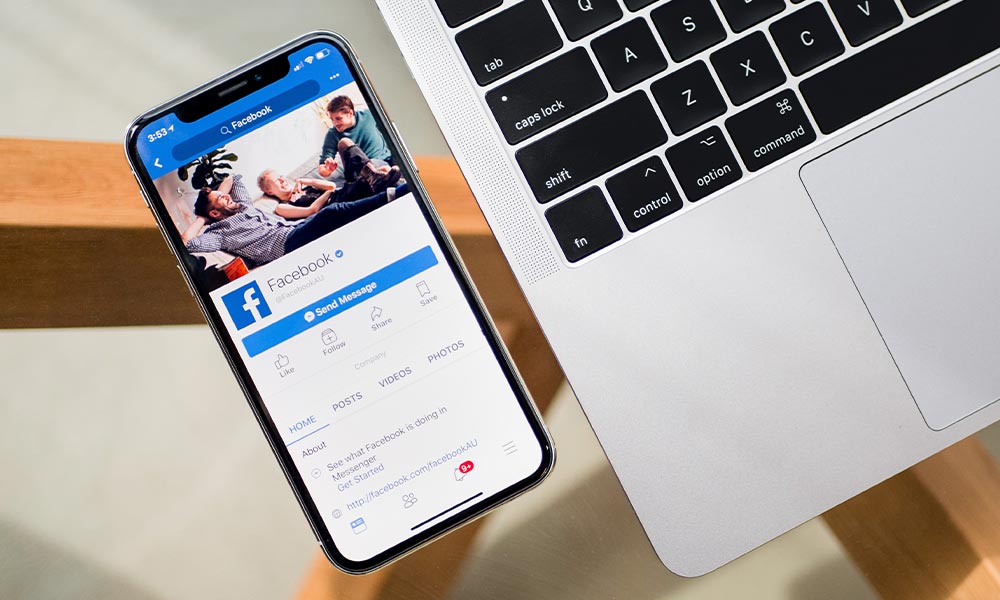
Facebook Metrics: The Fundamentals
Despite competition from YouTube in second position and newcomer TikTok, Facebook (owned by parent firm Meta) continues to be the most widely used social media platform. Facebook offers a variety of highly targeted and widely accessible advertising solutions for businesses. So, how can you develop and engage with Facebook analytics?
Engagement on Facebook
The amount of times people interact with your content is how engagement is calculated. Clicks, shares, comments, and reactions are examples of actions.
This is a useful indicator for determining how well your audience responds to your material. Your content strategy will be influenced by what kinds of posts users interact with. Improved engagement also increases the number of people who see your content in their followers' news feeds.
Reach
Reach tells you how many people have seen your post. It is now more challenging to have messages seen organically on Facebook due to algorithm changes. Therefore, even if a company has many Facebook followers, this does not guarantee that many of them will see its posts.
The 'Overview' tab of your Facebook Insights page lets you see topline reach data, and the 'Reach' tab provides more specifics. This indicator is helpful in illustrating the total number of unique viewers of your campaign or content.
Impressions
Impressions are the number of times your post was seen, whereas reach is the total number of individuals that saw it. An individual represents an increase of one in the reach figure and an increase of three in the impressions figure if they saw a single post on three distinct occasions.
Go to the "Posts" tab and select "Impressions: Organic/Paid" from the drop-down menu to get impressions data. You may determine how frequently your advertisement was displayed using this data.
Your frequency metric, which represents the typical number of times a person saw your advertisement, may be obtained by dividing your impressions by your reach. When attempting to estimate brand uplift or ad recall, this can be useful.
Likes & Followers for Pages
Likes and followers on Facebook are crucial audience metrics. While followers have expressed a wish to see posts from your pages on their newsfeeds, likes are those who have declared themselves to be fans of your page (although the algorithm does not guarantee that they will).
To ensure that you are not losing more admirers than you are acquiring, it is crucial to monitor your audience size.

Twitter Metrics: The Fundamentals
Twitter continues to undergo adjustments, but it remains a platform with a lot to offer marketers and businesses. Because hashtags are real-time, they can trend quickly, and businesses can use tweets to increase brand awareness and encourage participation. Let's examine the metrics that Twitter analytics should be looking at.
Impressions
The number of times a tweet appears as a consequence of a like, a search, or a display on your followers' timelines constitutes this indicator. This information can be discovered in your Twitter analytics by choosing "View tweet activity" and can reveal how your content or campaign has been distributed to audiences outside of your follower list.
Engagements
Engagement on Twitter refers to any action a user takes on your tweet, such as clicking a link, retweeting, replying, and liking. This metric shows whether or not your tweet inspired someone to learn more or spread the word. Under the "Tweet" tab, engagement statistics may be found. More engagements are a sign that users are interested in or enjoy your content.
Top Tweets
The most popular tweet for the current month can be found on the account homepage in Twitter analytics. The tweet with the most impressions is that one, which also includes the top card tweet and the top media tweet (includes a photo or video). Whether it be the kind of content, the hashtag used, the day and time of the tweet, or a combination of some or all of those elements, it's a crucial indicator of what resonates with your audience.
Brand New Followers
The number of new users who decided to follow your Twitter account in the last month is represented by the term "new followers." More than retweets or likes, choosing to follow your brand demonstrates a stronger relationship to it. This is a valuable key performance indicator (KPI) for how well your brand is doing overall at expanding its audience.
Top Followers
The top follower is the one who has been following you for the longest and has the most followers of their own. The most likely people to share your tweets with others by like or retweeting them are your top followers.
Top Mentions
The tweet in which your @handle was mentioned the most times was this one. The individuals that are behind your most popular tweets are frequently excellent candidates for potential influencer marketing campaigns because they have a sizable following and are interested in your company.
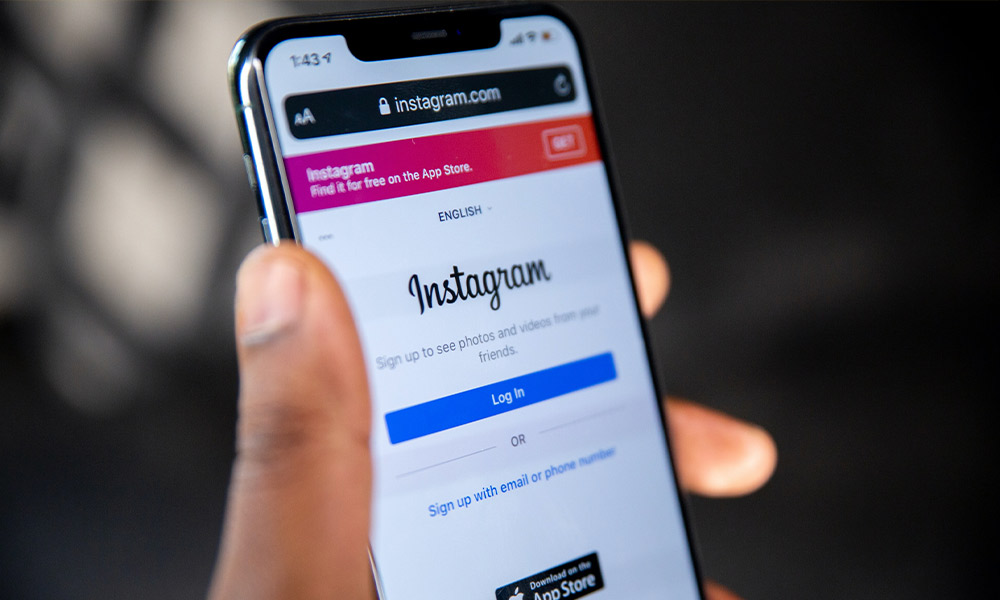
Basics Instagram Metrics
According to the Business of Apps, Instagram is the fourth most popular social media app in the world with over two billion monthly users. Instagram can be a useful tool for businesses trying to increase brand exposure and engagement, especially among people over 35, thanks to a recent concentration on video formats. Let's look at the most important parameters to monitor when utilising Instagram analytics.
Impressions
This represents how many times your audience has seen your content. Instagram analytics further dissects this information by displaying the impressions that originated from home, profile, and hashtags. Utilising hashtags wisely will increase the impressions of your posts.
Reach
Reach is yet another crucial indicator of how well a campaign or post is performing on Instagram. This is the total number of distinct individuals or accounts that have seen your post.
Interactions
This analyses user interactions with your content, such as likes, comments, shares, saves, and replies. This represents all user actions that have been made directly on your post.
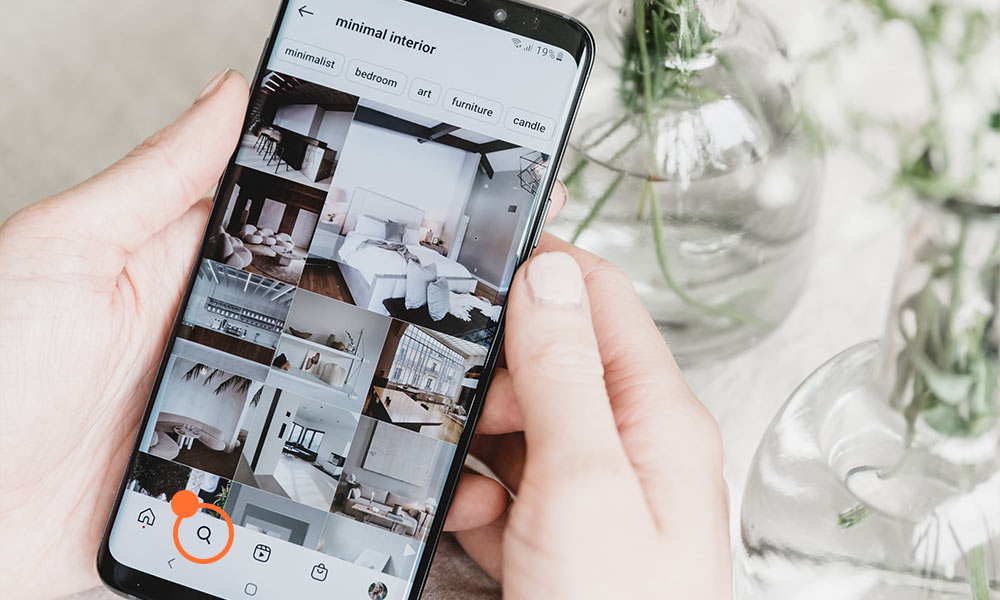
Explore
Users can discover fresh, pertinent content from accounts they might not already be following using Instagram's Explore feature. It consists of photographs, videos (for more information, see a reference to IG video formats), reels, and stories, all of which are curated by Instagram's algorithm based on comparable accounts or content that has been interacted with. The amount of users who were contacted through the feature but are not currently following you will be displayed in Instagram's insights.
Reached accounts and active accounts
Engagement with your feed and postings is shown by these measures. The number of distinct accounts that have viewed your material at least once is known as the number of accounts reached, which also includes social media demographics like the top nations, top cities, top age groups, and top genders.
Accounts engaged gives a breakdown (like the one above) of all the distinct accounts that have interacted with your material.
Basic TikTok Metrics
According to the Business of Apps, TikTok, the newest platform in town, has amassed over 1 billion users in just five years and generated $4.6 billion in income in 2021 alone. Its easy-to-use platform and entertainment value are to blame for this popularity.
Additionally, it is a platform that enables people and brands to become viral sensations, collecting fans and increasing brand recognition in the process. Look at the data you should monitor on TikTok because its usability for businesses is predicted to alter in 2023. (make sure you have a Business account to access analytics).
TikTok has four tabs for its analytics:
-
Overview
-
Content
-
Followers
-
LIVE
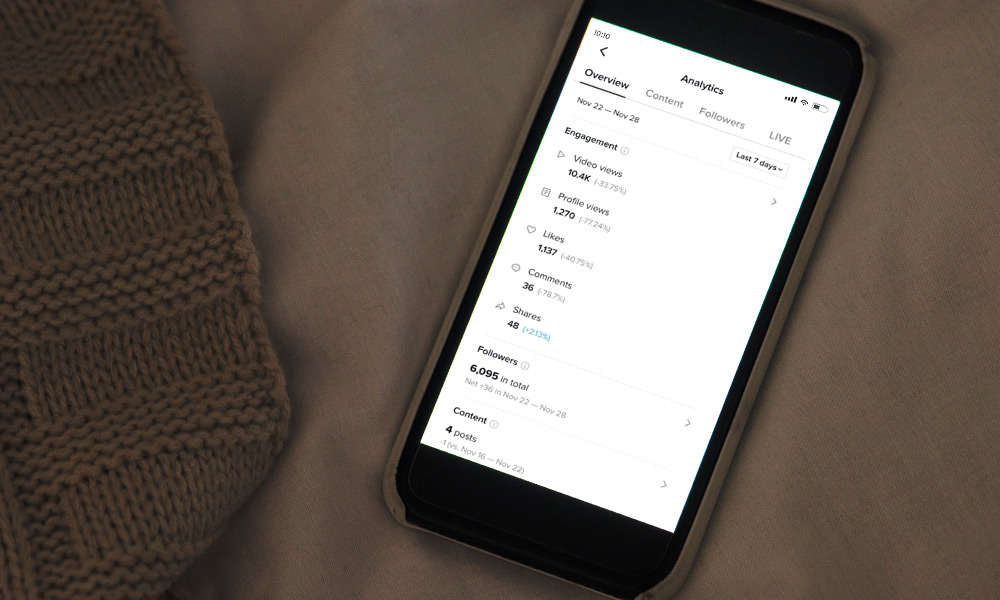
Overview
You may view other metrics, such as Engagement, Followers, and Content, under the "Overview" tab. It's a fantastic technique to gain understanding of the crucial TikTok account stats.
Here, you may view video views and profile views, which, if brand awareness is a KPI for your company, reveal how many people have viewed your profile. It also displays information about followers, shares, likes, and comments.
Content
The performance of your video material is the focus of the Content tab. Along with likes, comments, and shares on a video, it offers information on total video views, trending videos, and other statistics.
It can go farther by providing information such as the total play time, average watch time, audience reached, and the number of people who watched the entire video. You can determine what kind of video content is engaging your audience using this data.
Followers
You can learn more about your followers on this tab. It contains information about followers' gender, locations, and follower activity, which lets you know when they are online. Additionally, there are videos and audio files that your followers view and listen to.
LIVE
A significant component of TikTok is LIVE Live video, which is a fantastic method to increase engagement and receive incentives or freebies like Diamonds. The stats are displayed on the tab, along with viewer count and unique viewers, as well as total views and time.
Hashtags
On TikTok, hashtags are very popular, so keeping an eye on performance can be useful. The amount of times a hashtag has been viewed is indicated by its hashtag views. To find out what's hot or popular, you may also search for a hashtag in the "Discover" area.
Fundamentals LinkedIn Metrics
The social media platform LinkedIn, which will be 20 next year, has grown to have more than 875 million users globally. It is regarded as the top B2B platform and a place where people may progress their professions. Let's learn how to monitor the success of your B2B campaigns using LinkedIn analytics.
Visitors
Visitor analytics will assist you identify who is visiting your page and identify dips and peaks in traffic so you can determine which content is most popular. To go deeper into your visitor profile, such as job function, seniority, firm size, and industry, use filters below (page views, dates, unique visitors).
Followers
You may see the origins and demographics of people who follow your company page using LinkedIn's Follower tool. You can use this metric to find out who is following you and how to interact with them most effectively.
Engagement & Impressions
Impressions represent the number of times a user has seen your content. This measure is crucial because it lets you know how frequently your material is viewed and raises the likelihood that someone will interact with it. Track unique impressions as well because it indicates how many distinct LinkedIn users saw your content.
The amount of interactions, clicks, and new followers added on LinkedIn are added together and divided by the total number of post impressions to determine the engagement rate. You will have a more complete understanding of how material is performing if you include this in your study.
Competitor
This function, which compares follower metrics and organic content analytics, is found under the "Analytics" page and is currently only available to some users. You'll learn more about the types of content that succeed for your competition and receive insight into their audience.